Category Archives: GIS/RS

GIS, Remote Sensing

Assistant Professor of Medical Geography at Binghamton University

Assistant Professor of Medical Geography

Institution:
Location:
Binghamton, NY
Category:
Faculty – Science – Geography
Posted:
11/04/2015
Application Due:
01/05/2016
Type:
Full Time
About Binghamton University:
Binghamton University has built a reputation as a world-class institution that combines a broadly interdisciplinary, international education with one of the most vibrant research programs in the nation. Binghamton is proud to be ranked among the elite public universities in the nation for challenging our students academically, not financially. The result is a unique, best-of-both-worlds college experience.Our academic culture rivals a first-rate private university – rigorous, collaborative and boldly innovative — while our campus culture exemplifies the best kind of public university experience: richly diverse students, active social life and deep engagement with the community.

Our students, both undergraduate and graduate, work one-on-one with an exceptional faculty that includes innovative scientists and groundbreaking scholars. They take advantage of special academic opportunities like combined degrees, foreign language study groups and an unparalleled international education program.

Job Description:
The Binghamton University Department of Geography seeks an Assistant Professor of Geography with a specialty in medical geography to conduct research and teach in the areas of health disparities, or health/health care equity issues, health-seeking behavior, health issues for vulnerable populations, or disease distributions and vulnerable populations beginning September 2016. As increasingly important aspects of health and sustainability, the research and teaching should be within social/human or urban geography subspecialties. The successful candidate will participate with local communities for continued internship placements, student supervision and local project development. Must be able to direct graduate level data-based thesis/research, and to teach in Population, Health and GIS graduate area. Ability to teach successfully a large-enrollment undergraduate course, to teach technical and research skills, develop a research agenda, and to participate as a team member in a busy department are crucial.

Requirements:
Ph. D. in Geography required. Specialty in medical geography; conduct research/teach in geography of health disparities, health equity, health-seeking behavior; social/human/urban geography; ability to direct data-based graduate research; teach large enrollment class; teach technical methods and research skills; use GIS; anticipated sponsored research

Additional Information:
It is the policy of Binghamton University to provide for and promote equal opportunity employment, compensation, and other terms and conditions of employment without discrimination on the basis of age, race, color, religion, disability, national origin, gender, sexual orientation, veteran or military service member status, marital status, domestic violence victim status, genetic predisposition or carrier status, or arrest and/or criminal conviction record unless based upon a bona fide occupational qualification or other exception.

Application Instructions:
Submit letter of application, curriculum vita, contact information for three (3) references, and samples of recent publications. Closing date: January 5, 2016.
Please direct any questions to fio@binghamton.edu or nhenry@binghamton.edu.

Link: https://www.higheredjobs.com/search/details.cfm?JobCode=176164358

Ten free GIS data websites

Check out the links below for 10 very useful websites for downloading GIS data free of charge:

New article on surface depression published in IJGIS

My new peer-reviewed article titled “A localized contour tree method for deriving geometric and topological properties of complex surface depressions based on high-resolution topographical data”  has been published in the latest issue of International Journal of Geographical Information Science, Issue 12. You can download a free online copy using this link: http://www.tandfonline.com/eprint/r34t6WVptm2hUgfjQc5r/full.  In this paper, we developed a localized contour tree method that is able to fully exploit high-resolution topographical data for detecting, delineating and characterizing surface depressions across scales with a multitude of geometric and topological properties. See some figures below:

multi-branch-depression_all_contour

Figure3_contour_tree

Figure6_dem_shadedrelief

Figure8_depression_levels

Access Landsat Imagery in ArcGIS Pro

Related post: Landsat 8 data on Amazon AWS

Here’s how you can access the Landsat archive which is hosted on Amazon through ArcGIS Pro.

  1. Open the Projects Pane
  2. Click on Portal and then on the cloud icon on the far right to see everything that’s on your portal.
  3. Search for “Multispectral Landsat” in the search bar.
  4. Drag and drop.

To take advantage of the archive, we’ve designed a number of pre-defined band combinations and indices. You can find these from the Data tab, under Processing Templates.

Play around with these. Here’s some cool stuff that I found poking around in Alaska for a few minutes.

Read the rest of this entry

Whitebox GAT’s new website and other developments

Check out Prof. John Lindsay’s new Whitebox GAT website and the GoSpatial. A lot of cool and innovative stuff!!

“GoSpatial is a command-line interface program for analyzing and manipulating geospatial data. It has been developed using the Go programming language and is compiled to native code. The project is experimental and is intended to provide additional analytical support for the Whitebox Geospatial Analysis Tools open-source GIS software. GoSpatial can however be run completely independent of any other software and is run from a single self-contained executable file.”

2015 Esri User Conference Plenary Session Videos Available

The 2015 ESRI International User Conference is happening now in San Diego, California with 16,000 attendees. Some of the new features released on Monday’s plenary sessions include:

My personal favorite is the R & ArcGIS. More information about this can be found in another blog at https://gisday.wordpress.com/2015/07/21/r-bridge-for-arcgis/.

The following videos from the Plenary Session on Monday, July 20, 2015, are now available for viewing at http://video.esri.com/series/250/2015-esri-user-conference-plenary-_dash_-watch-the-entire-day:

• Keynote from Jack Dangermond
• R&D at Esri
• Southwest Florida Water Management District – A Mission-Critical Approach to Water
• Hartsfield-Jackson Atlanta International Airport – Web GIS Delivers Safety and Efficiency
• Beck’s Hybrids – Feeding the World: Precision Agriculture Simplified
• State of Victoria, Australia, Government – Proactive Rejuvenation: Ignite Your Potential
• World Health Organization – The Battle against Ebola and Polio
• National Geographic Society – Understanding Geography
• Mentoring the Next Generation – Connecting GIS with Education
• Keynote from Martin O’Malley – Smart Government: Reduce the Distance between People

Check out here for some pictures I took at the conference.

R-ArcGIS

R-bridge for ArcGIS

Source: http://blogs.esri.com/esri/esri-insider/2015/07/20/building-a-bridge-to-the-r-community/

R-bridge for ArcGIS: https://github.com/R-ArcGIS/r-bridge

R-ArcGIS: https://r-arcgis.github.io/

Today at the Esri User Conference in San Diego, Esri announced a new initiative to build a collaborative community for R and ArcGIS users.

Esri has been teaching and promoting integration with R at the User Conference and Developer Summit for several years. During this time we have seen significant increase in interest, and received useful feedback from our ArcGIS users and R users about a variety of needs and techniques for integrating ArcGIS and R. Based upon this feedback, we are working with ArcGIS and R users to develop a community to promote learning, sharing, and collaboration. This community will include a repository of free, open source, R scripts, geoprocessing tools, and tutorials.

I recently sat down with Steve Kopp, Senior Product Engineer on the spatial analysis team, and Dawn Wright, Esri’s Chief Scientist to talk about what this focus on building a bridge to the R community means for ArcGIS users and other users of R.


Matt Artz:
What is R?

Steve Kopp: R (aka the R Project for Statistical Computing) is an extremely popular and the fastest growing environment for statistical computing. In addition to the core R software, it includes a more than 6,000 community-contributed packages for solving a wide range of statistical problems, including a variety of spatial statistical data analysis methods.

Dawn Wright:  R is widely used by environmental scientists of all stripes, as well as statisticians. Since R has limited data management and mapping capabilities, many of our users find good synergy in using R and ArcGIS together.


Matt Artz:
Does the ArcGIS community use R today?

Steve Kopp: Yes, R has become very popular in the ArcGIS community over the last several years.  Many in our user community have been asking for a mix of its functionality with our own, as well as better code-sharing interaction with the R community.

Dawn Wright: A great example from the marine ecology community is Duke University’s Marine Geospatial Ecology Tools, where they have already long since moved forward with integrating R and ArcGIS for Desktop for some time.


Matt Artz:
What is the R – ArcGIS Bridge?

Steve Kopp: This is a free, open source R package which allows ArcGIS and R to dynamically access data without creating intermediate files on disk.


Matt Artz:
Why did Esri build the R – ArcGIS Bridge? 

Steve Kopp: It was built for three reasons: to improve the performance and scalability of projects which combine R and ArcGIS; to create a developer experience that was simple and familiar to the R user; and to enable an end-user experience that is familiar to the ArcGIS user.

Dawn Wright: The bottom line is that this project is about helping our user community and the R user community to be more successful combining these technologies.


Matt Artz:
So is this initiative just some software code?

Steve Kopp: No, the R – ArcGIS Bridge is simply some enabling technology, the real effort and value of the R – ArcGIS Community initiative will be in the development and sharing of useful tools, tutorials, and tips. It’s a free, open source library which makes it fast and easy to move data between ArcGIS and R, and additional work which makes it possible to run an R script from an ArcGIS geoprocessing tool.

Dawn Wright: This community will be important and useful for R users who need to access ArcGIS data, for ArcGIS users who need to access R analysis capabilities from ArcGIS, and for developers who are familiar with both ArcGIS and R who want to build integrated tools or applications to share with the community.

Steve Kopp: The community of tools will be user developed and user driven. Esri will develop a few sample toolboxes and tutorials, but our primary interest is to facilitate the community and help them build what they find useful.


Matt Artz:
How do you see the ArcGIS community using the R – ArcGIS Bridge?  What does it give them that they don’t have today? 

Steve Kopp: The R – ArcGIS Bridge allows developers with experience with R and ArcGIS to create custom tools and toolboxes that integrate ArcGIS and R, both for their own use, and for building toolboxes to share with others both within their organization and with other ArcGIS users.

Dawn Wright: R developers can quickly access ArcGIS datasets from within R, save R results back to ArcGIS datasets and tables, and easily convert between ArcGIS datasets and their equivalent representations in R.

Steve Kopp: It allows our users to integrate R into their workflows, without necessarily learning the R programming language directly.


Matt Artz:
What about the R user who doesn’t use ArcGIS?

Steve Kopp: It’s not uncommon in an organization for a non-GIS person to need to be able to work with GIS data; for these people, they will be able to use the bridge to directly access ArcGIS data without creating intermediate shapefiles or tables, and without needing to know any ArcGIS.


Matt Artz:
How can people start using the R Bridge? 

Steve Kopp:  The R – ArcGIS community samples, tutorials, and bridge are all part of a public GitHub community site similar to other Esri open source projects. And if you happen to be at the Esri User Conference in San Diego this week, this project will be discussed as part of a workshop on Wednesday.

– See more at: http://blogs.esri.com/esri/esri-insider/2015/07/20/building-a-bridge-to-the-r-community/#sthash.0lSJ6kGl.dpuf


New ESA satellite – Sentinel-2A delivers first images

The new ESA satellite – Sentinel-2A was successfully launched on 23 June, 2015.  See below for the key facts of the satellite.  The first few images obtained by the satellite have been released.  The data will be freely available to the public later this year. Stay tune!

Orbit: Polar, Sun-synchronous at altitude of 786 km

Revisit time: Five days from two-satellite constellation (at equator)

Coverage: Systematic coverage of land and coastal areas between 84°N and 56°S

Instrument: Multispectral imager (MSI) covering 13 spectral bands (443 nm–2190 nm) with a swath width of 290 km and spatial resolutions of 10 m (4 visible and near-infrared bands), 20 m (6 red-edge/shortwave-infrared bands) and 60 m (3 atmospheric correction bands)

The imager’s 13 spectral bands, from the visible and the near infrared to the shortwave infrared at different spatial resolutions, take land monitoring to an unprecedented level. In fact, Sentinel-2 is the first optical Earth observation mission of its kind to include three bands in the ‘red edge’, which provide key information on the state of vegetation.

The spacecraft will also be readied to start the routine acquisition of high-resolution images of Earth’s land surfaces, large islands, inland and coastal waters on a ten-day revisit cycle, which will drop to five days when the constellation with the Sentinel-2B satellite is implemented in 2016.

French Riviera

Algerian Sahara

2015 Journal Impact Factor Released

The 2015 Journal Impact Factor has been released. You can download the complete list here.

I sorted out some journals related to Remote Sensing, Geography, and  Hydrology. You can download my sorted list here.

It appears that the impact factors of several remote sensing journals have increased from 2.x to 3.x, such as International Journal of Applied Earth Observation and Geoinformation, Remote Sensing.  Note that this journal impact factor ranking is slightly different from the Google Scholar Journal Ranking.

Keep in mind that journal impact factor is just one metrics, so don’t take it too seriously!

Remote Sensing Journals Total Cites  Impact Factor
Remote Sensing of Environment 34609 6.393
IEEE Transactions on Geoscience and Remote Sensing 25780 3.514
International Journal of Applied Earth Observation and Geoinformation 2,600 3.470
International Journal of Digital Earth 603 3.291
Remote Sensing 3061 3.180
ISPRS Journal of Photogrammetry and Remote Sensing 4120 3.132
IEEE Journal of Selected Topics in Applied Earth Observations and Remote Sensing 2331 3.026
IEEE Geoscience and Remote Sensing Letters 4502 2.095
GIScience & Remote Sensing 461 1.770
Canadian Journal of Remote Sensing 1,651 1.727
International Journal of Remote Sensing 16435 1.652
Photogrammetric Engineering & Remote Sensing 5926 1.608
Remote Sensing Letters 516 1.573
Journal of Applied Remote Sensing 990 1.183

Remote Sensing Journals Google Scholar Ranking

Geography Journals Total Cites  Impact Factor
Landscape and Urban Planning 7409 3.037
Progress in Physical Geography 2,749 2.612
Applied Geography 2,656 2.494
Annals of the Association of American Geographers 3,776 2.291
Permafrost and Periglacial Processes 1,413 2.119
The Geographical Journal 1,298 1.926
International Journal of Geographical Information Science 3,193 1.655
Geographical Analysis 1,627 1.543
The Professional Geographer 1,419 1.500
Transactions in GIS 746 1.398
Journal of Geographical Sciences 938 1.344

Geography Journal Google Scholar Ranking

Hydrology Journals Total Cites  Impact Factor
Journal of Hydrometeorology 6,182 3.645
Water Resources Research 38,033 3.549
Hydrology and Earth System Sciences 8855 3.535
Advances in Water Resources 6,998 3.417
Journal of Hydrology 33300 3.053
Hydrological Processes 15,618 2.677
Journal of Water Resources Planning and Management 3,491 2.676
Water Resources Management 5,225 2.600
Ecohydrology 1,234 2.426
Groundwater 5,318 2.307
Hydrogeology Journal 3,895 1.966
Vadose Zone Journal 3,020 1.778
Journal of Hydrologic Engineering 3,054 1.583
Hydrological Sciences Journal 3,849 1.549
JAWRA Journal of the American Water Resources Association 4,275 1.348

Hydrology Journals Google Scholar Ranking

Wetlands Journals Total Cites  Impact Factor
ENVIRONMENTAL MODELLING & SOFTWARE 7249 4.420
LANDSCAPE ECOLOGY 6,054 3.500
ECOLOGICAL INDICATORS 5,651 3.444
WETLANDS 3439 1.572
WETLANDS ECOLOGY AND MANAGEMENT 1275 1.274

Asia & Australia SRTM 30 m Available

The void-free 1 arc second (~ 30 meters) SRTM data for Asia and Australia are available now. See below for an index map of the newly available full-resolution data. The new data are available for download from the USGS EROS Data Center.

See an ESRI blog below for more details:

Asia & Australia SRTM 30 m in Esri World Elevation Services

Esri World Elevation Layers  are enhanced with more detailed void-free 1 arc second (~ 30 meters) SRTM data for Asia and Australia. The Australian DEM (DEM-S), which is a cleaned and smoothed version of SRTM 1 arc sec, is courtesy of Geoscience Australia, while the Asia data is acquired from NASA. With this update, there is now 3 times more detail in these areas.

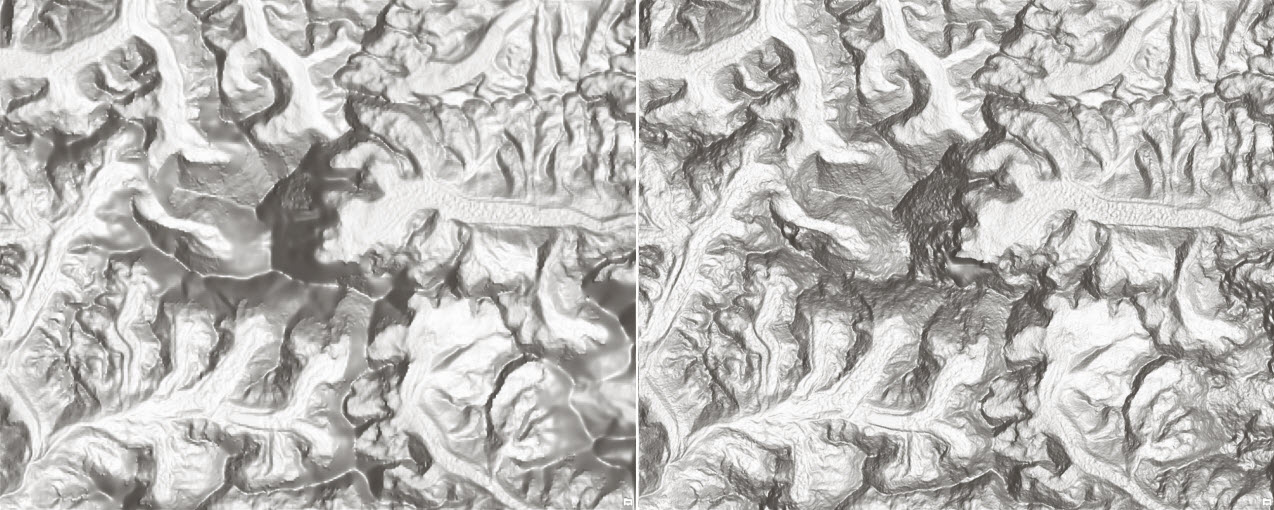
Mount Everest – the highest peak in Himalayas and World at 8,848 m (29,029 ft) above sea level (SRTM 90 m vs SRTM 30 m)

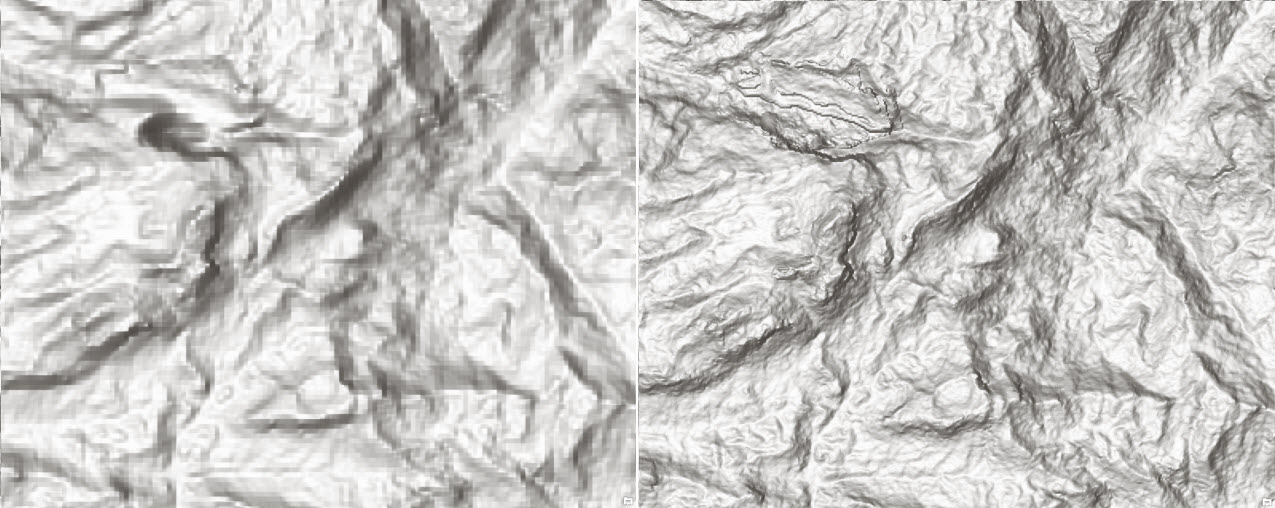
Eravikulam National Park, Western Ghats, Kerala, India. Western Ghats mountain range is UNESCO World Heritage Site and is one of the eight “hottest hotspots” of biological diversity in the world (SRTM 90 m vs SRTM 30 m)

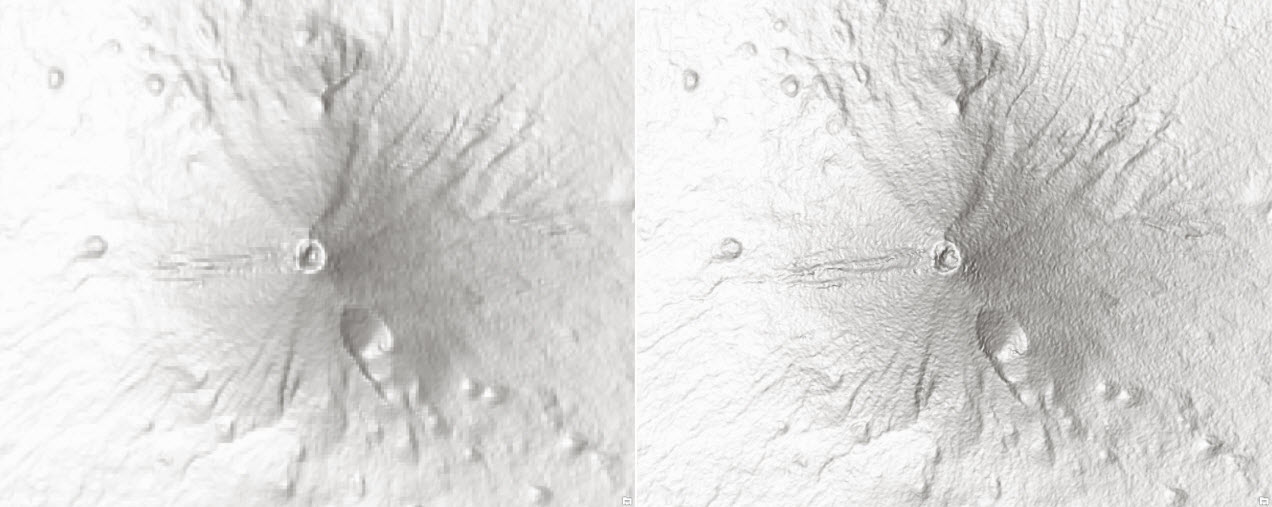
Mount Fuji, Japan – an active stratovolcano and the highest mountain in Japan at an elevation of 3,776.24 m (12,389 ft) above sea level (SRTM 90 m vs SRTM 30 m)

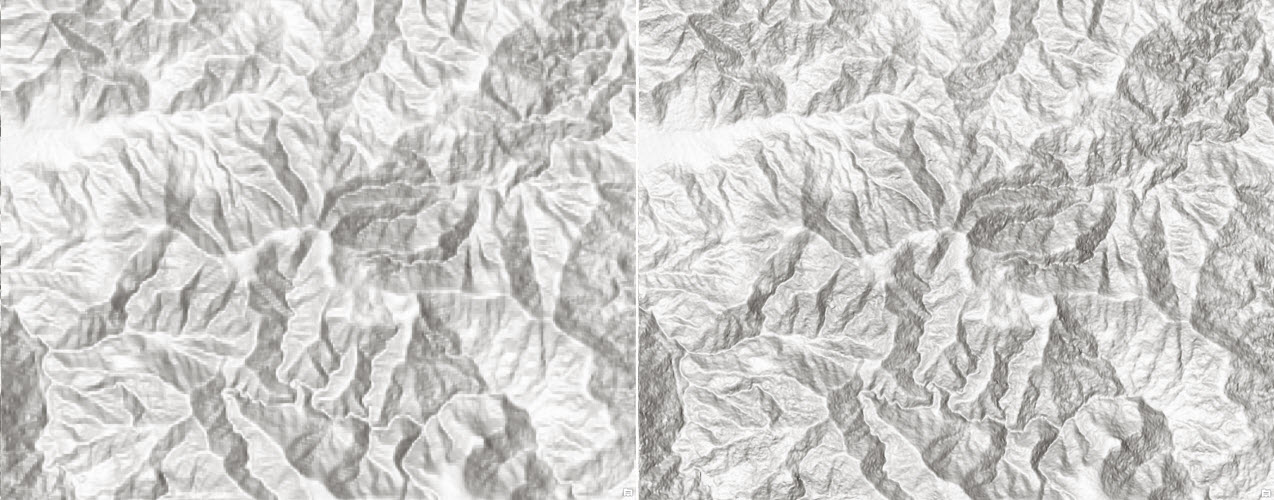
Mount Bogong, Australia – is part of the Victorian Alps of the Great Dividing Range and the highest mountain in Victoria, Australia, at 1,986 meters (6,516 ft) above sea level (SRTM 90 m vs SRTM 30 m)

Our dynamic world elevation image services (Terrain and TopoBathy) are not just for visualization (such as multi-directional hillshade,tinted hillshade) but provide access to raw elevation values and derivatives (such as slope, aspect) for analysis. Access to these global layers is free and does not consume any credits; all you need is an ArcGIS Organizational account. It’s that easy!

With this update and previously released Africa , South America & Western Europe, SRTM 1 arc second is now available for the most part of the world from N 60 to S 60 as depicted below:

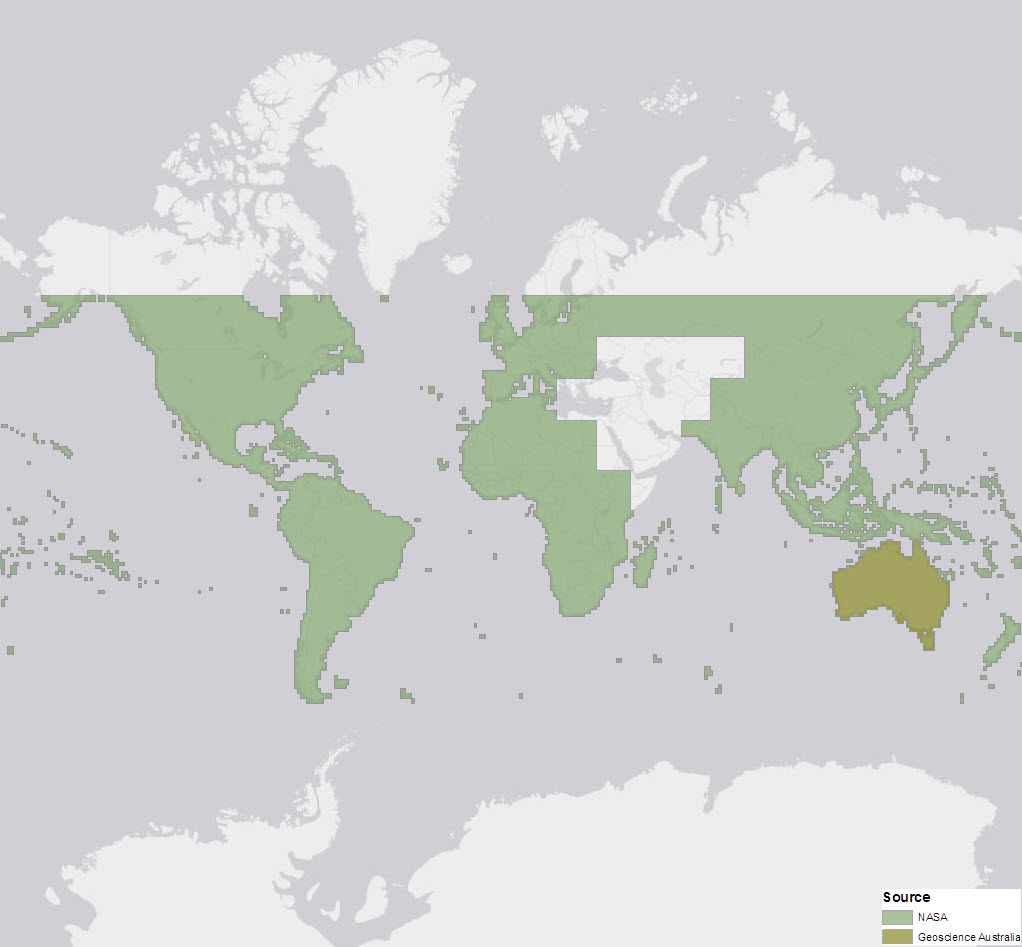
SRTM 1 arc second (~30 meter) covers land areas between 60 degrees north and 56 degrees south

Elevation Analysis Services are also updated to consume SRTM 1 arc second for Profile, Viewshed and Summarize Elevation tasks. SRTM updates are also rolled out in Terrain 3D service powering Web Scene viewer and ArcGIS Pro Scene.

For more information about the coverage of the World Elevation services please check out our Elevation coverage map.

by Rajinder Nagi, Lead Community Elevation

Alex Tereshenkov

Programming and managing GIS

REDD+ for the Guiana Shield

Technical Cooperation Project

LidarBlog.com

Dr. Qiusheng Wu @ University of Tennessee

Writing Science

How to write papers that get cited and proposals that get funded

GIS In Ecology

Providing Training, Advice And Consultation On The Use Of GIS In Ecology

metrhispanic

On cities, land, ...

r4hydrology

Learning hydrology with R

GIS and Science

Applications of geospatial technology for scientific research and understanding.

TopoToolbox

MATLAB-based software for topographic analysis

Anything Geospatial

Dr. Qiusheng Wu @ University of Tennessee

GeospatialPython.com

Dr. Qiusheng Wu @ University of Tennessee

Another GIS Blog

Dr. Qiusheng Wu @ University of Tennessee

ArcPy Café

Get all your ArcGIS Python Recipes here!

Planet Python

Dr. Qiusheng Wu @ University of Tennessee

R-bloggers

R news and tutorials contributed by hundreds of R bloggers

ArcGIS Blog

Dr. Qiusheng Wu @ University of Tennessee